
What Controls Water Quality in Clear Lake?
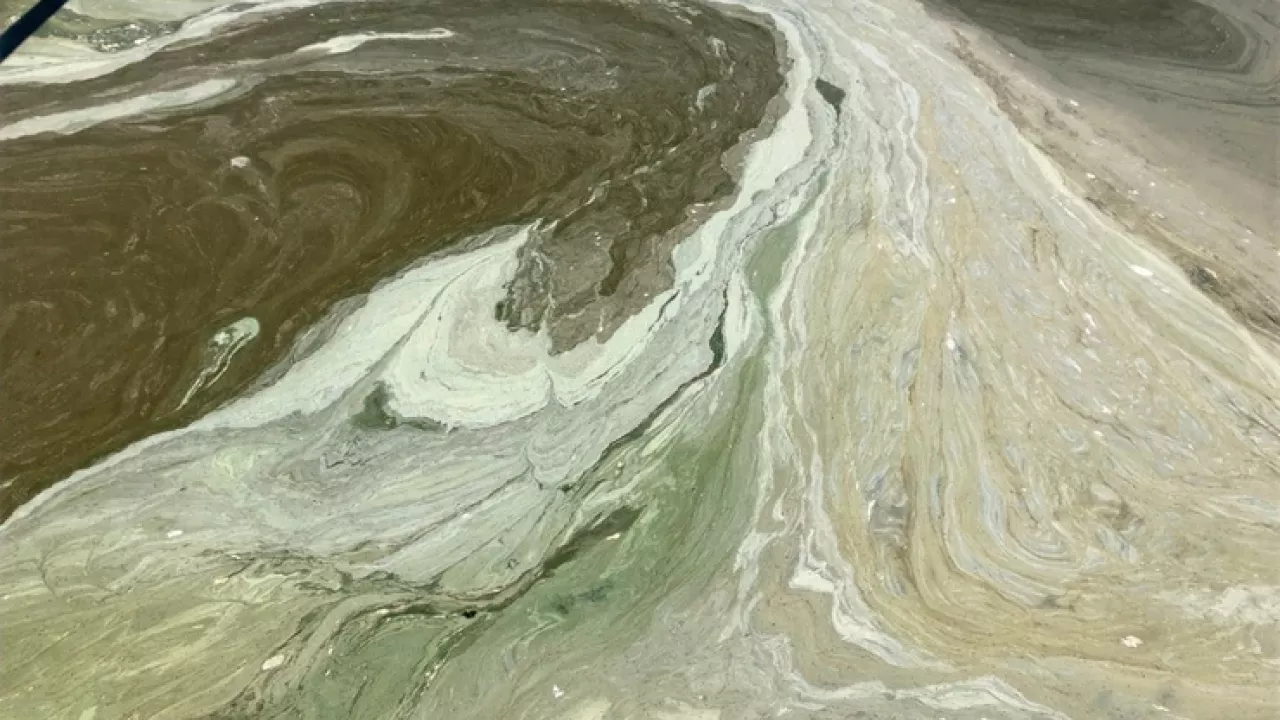
The current "abstract art" happening at Clear Lake, CA due to toxin-producers (cyanobacteria) is very intriguing and concerning (Soda Bay, June 23, 2020).
Signs of Deteriorated Water Quality: TERC Goals
More frequent and potentially toxic cyanobacterial blooms (or Harmful Algae Blooms, HAB) like those happening this summer at Clear Lake, justify the efforts that TERC Clear Lake Research Team are conducting. Our work is directed at (1) understanding what controls the water quality and the ecological health in Clear Lake, and (2) creating predictive tools that enable stakeholders to evaluate future options.
The field and laboratory measurements we have been taking are providing the quantitative understanding of the lake status, which builds on past investments in Clear Lake Science. Most of those past measurements have been focused on studying the impact of excess nutrients entering the lake through creeks and runoff (i.e. external loading) on the lake water quality causing increasing HABs, among other problems. However, one of TERC’s main goals is to quantify the significance of the excessive nutrient release from the sediments when dissolved oxygen levels are low in the water column (i.e. internal loading).
When and Why Do Low Dissolved Oxygen Levels Occur at Clear Lake?
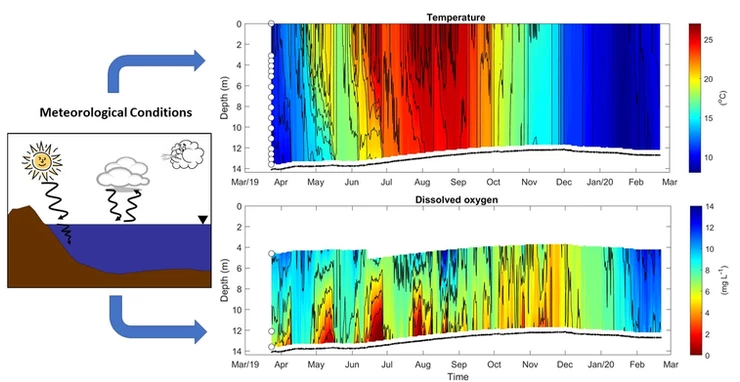
Dissolved oxygen availability is essential for maintaining healthy aquatic ecosystems. Dissolved oxygen gets consumed by respiration and multiple biogeochemical processes both in the water column and next to the sediments. However, when the water column develops temperature gradients in depth with warm temperatures at the surface and cold temperatures underneath (i.e. becomes thermally stratified), dissolved oxygen levels next to the sediments are depleted, due to its continuous consumption with lack of exchange with the atmosphere. Thus, we say this part of the water column becomes hypoxic or with low dissolved oxygen levels. As a result, TERC has obtained high-resolution measurements of both lake temperature and dissolved oxygen concentrations throughout the water column at multiple locations across the lake for more than a year to quantify for how long and where low dissolved oxygen levels or hypoxia occur in the lake. Also, the research team is testing an analytical method to predict hypoxia using basic meteorological information such as air temperature, relative humidity, solar radiation, wind speed, and lake surface temperature.
Impact of Hypoxia on Water Quality and Ecological Health in Clear Lake
The reduction of dissolved oxygen through the water column can have multiple implications in aquatic ecosystems, such as increasing harmful algal blooms (HABs), triggering the release of nutrients accumulated in the sediments, or decreasing the available fish habitat.
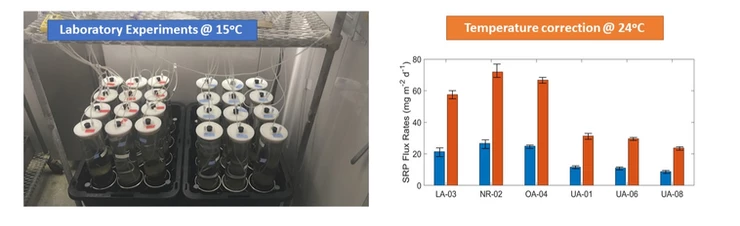
Under low lake dissolved oxygen levels, nutrients accumulated in the sediments (particularly phosphorus in Clear Lake) can be released and added to the water column, representing a thread for the lake water quality. We have conducted laboratory experiments to quantify the rate of phosphorus release from the sediments under low dissolved oxygen levels. Results from these experiments have provided the first direct estimate of the annual internal load of phosphorous in Clear Lake. We estimated that phosphorous release from the sediments represents ~40% of the total phosphorus annual load in the lake assuming cold lake temperatures. However, this fraction can increase under warm lake temperatures. This summer we are conducting the second laboratory experiment to validate and quantify our hypothesis about the significance of internal loading in Clear Lake.
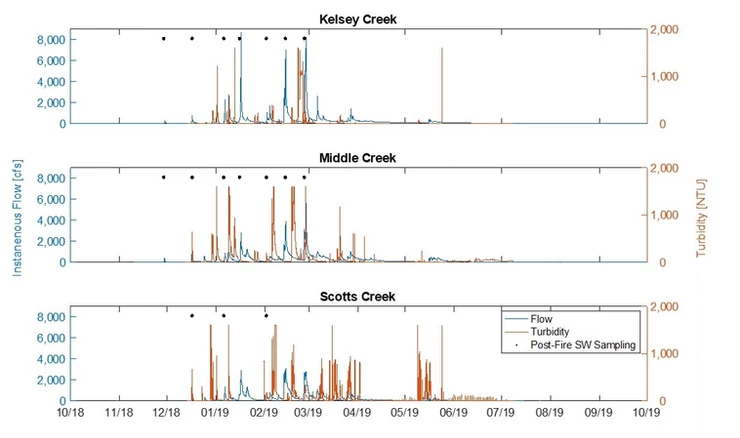
In the field, we are continuously measuring turbidity and flow at the three main streams entering the lake as a reference for the nutrients added to the lake due to external sources. The Lake County Department of Water Resources is collecting grab samples during the wet season (December-March), which will help us to provide a more accurate estimate of stream nutrient loading into the lake.
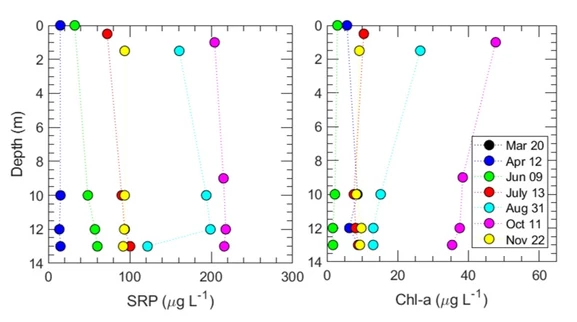
We evaluate the impact of internal and external nutrient loads on the lake water quality by measuring multiple constituents throughout the water column and across the lake 6-7 times a year. We collect water samples to quantify dissolved and particulate forms of nitrogen, phosphorus, and carbon, chlorophyll, and particle size distribution. For example, our long-term records show a direct relationship between soluble reactive phosphorous (SRP) and chlorophyll at the end of the summer, when creeks are barely running into the lake. Thus, lake oxygenation could reduce the internal load of phosphorus and control algae blooms.
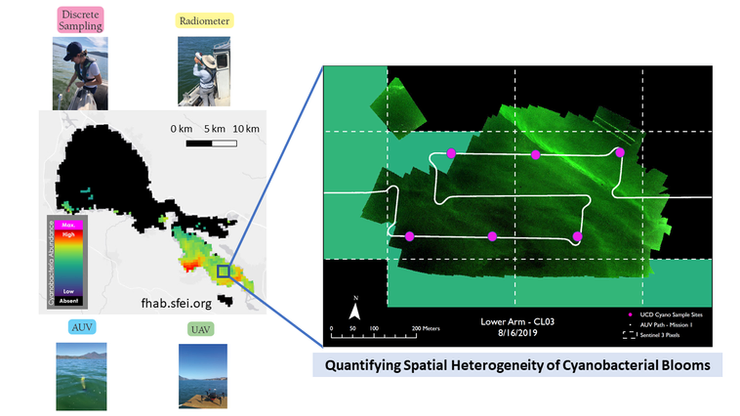
Dissolved oxygen is also relevant for cyanobacterial growth. TERC Research Team has used different sampling techniques to quantify the spatial variability of cyanobacterial blooms in Clear Lake at finer spatial scales than available satellite imagery or remote sensing tools for this lake (https://fhab.sfei.org/). We deployed an autonomous underwater vehicle (AUV), a drone, a radiometer, and completed discrete sampling in Clear Lake and are comparing the results to a satellite algorithm aimed at detecting cyanobacteria blooms. We are using the data collected to quantify scales of variability of cyanobacterial blooms and ground-truth satellite data.
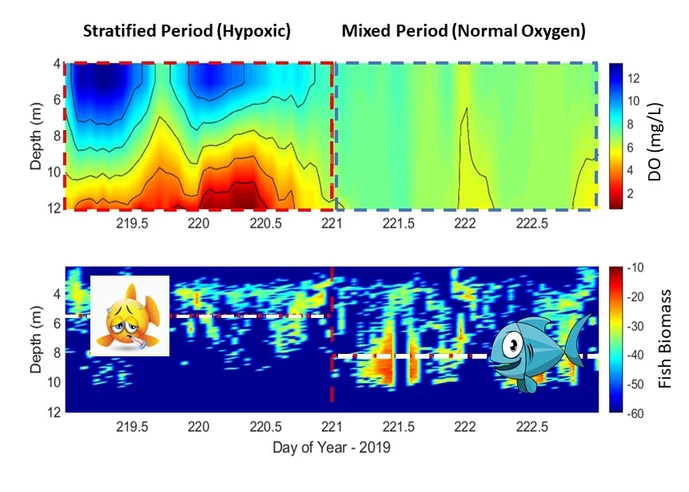
Finally, dissolved oxygen is also essential for fish. TERC Research team has used echosounder or sonar technology based on sound propagation to quantify fish biomass underwater and under different conditions. During low oxygenated periods (or stratified), fish moved to shallow depths, while fish stayed in depth when the water column was fully mixed and dissolved oxygen levels were high throughout the whole water column. Thus, fish are changing their vertical distribution under hypoxic conditions.
Building up Predictive Tools to Support Lake Management Decisions
The field and laboratory measurements are essential to build, calibrate, and validate a three dimensional (3-D) numerical lake model. A numerical lake model is a computer model that uses sets of mathematical equations to reproduce the different processes which are occurring in the lake (mixing, stratification). The model is 3-D because it takes into account changes both in the horizontal and vertical direction. The processes the model simulates are organized into two groups: those that characterize how the water moves (i.e. hydrodynamic) and those that modify nutrients, dissolved oxygen, and algae in the lake (i.e. water quality). We are currently working on the calibration/validation of the hydrodynamic model. The calibration process is a trial and error process in which we adjust parameters of the mathematical equations to reduce the error between field observations and lake model results. During the validation, we use a different set of field data without changing any parameters, and we expect a good agreement between observations and model results. Once the validation is completed, we are expecting to use the model to explore different questions regarding lake water quality (e.g. dissolved oxygen enhancement techniques, the fate of streams, and culvert loads).
For example, let’s do a modeling experiment: Imagine that we release 3 particles in the center of the Upper Arm in early spring. Then, we let the particles move under the influence of the measured conditions for two weeks. You may wonder if the particles stay in the Upper Arm, or if they move to the other two basins. The video shows the three dimensional (3-D) lake model results of one of the possible pathways that these 3 particles released in the Upper Arm may take. We used a different color to trace the path of each particle. These particles could be algae, phosphorus-rich sediment, particulate mercury, or even a dissolved material (oxygen, nutrients). Each particle followed a completely different pathway, which highlights the complexity of the hydrodynamics or water movement in this system. Thus, how particles and solutes distribute in Clear Lake will impact its water quality. Our field sampling plan is focused on improving our understanding of what are the factors affecting the different pathways. Once we understand them, we will be able to change the system to produce the desired outcomes as a result of future challenges, such as climate change or more intense harmful algae blooms.